How to Set Up Automated Reporting and Status Updates (So You Never Pull a Report Manually Again)
Manually pulling data from different tools to build weekly reports is one of the biggest hidden time costs in service businesses. Here's how to automate your reporting so it builds and sends itself to your inbox, your Slack, or your clients, on a schedule.
Wambui Ndung'u

Every Friday afternoon, someone on your team opens ClickUp, pulls the task count, switches to Airtable or Google Sheets, grabs the lead numbers, opens the invoicing tool, checks what's been paid, and pastes it all into a Google Doc. An hour later, there's a weekly report that takes five minutes to read.
That ratio, one hour to produce, five minutes to consume, is wrong. And it's happening every week.
Here's how to flip it: your data flows automatically, the report writes itself, and it's in your inbox before you've finished your morning coffee.
What Automated Reporting Actually Solves
Manual reporting has two problems that people rarely talk about:
It depends on someone remembering to do it. When reporting is a manual task, it gets done when someone has time. Which means it's late, inconsistent, and occasionally skipped entirely.
The data is already stale by the time it's written. If you're pulling last week's numbers on Friday afternoon, you're always working a week behind. Automated reporting can pull live data, showing you exactly where things stand right now.
An automated reporting setup fixes both. It pulls data on a schedule, formats it cleanly, and delivers it automatically. No human intervention required.
What You'll Be Able to Do After This
Once this is set up:
- ✅ A scheduled scenario runs automatically every Friday (or whenever you choose)
- ✅ Data is pulled from ClickUp, Airtable, and your invoicing tool automatically
- ✅ It's compiled into a readable summary and delivered to your Slack or inbox
- ✅ Clients can receive a project-specific version automatically
- ✅ A historical record is kept in a Google Sheet — always up to date
No manual data gathering. No formatting. No forgetting.
💡 Time to build this: 1–2 hours for the initial setup. Most of the time is spent defining exactly what data you want and making sure it's clean in your source tools.
How It Works: Step by Step
Step 1: Define Exactly What Your Report Needs to Include
This is the most important step in the whole process, and the one most people skip.
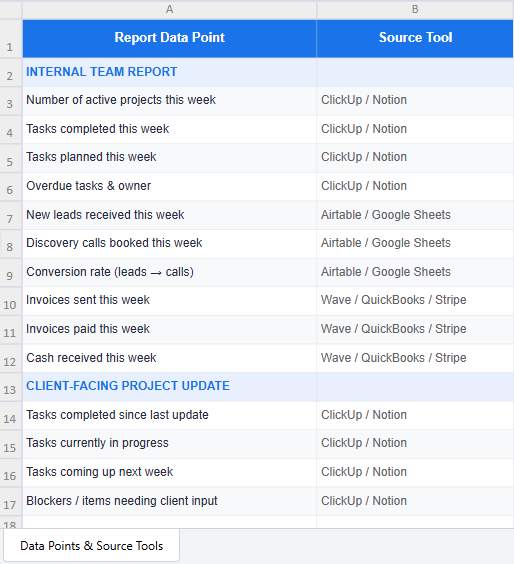
Before touching Make.com, sit down and write out the exact data points your weekly report needs. Be specific. For example:
Internal team report:
- Number of active projects this week
- Tasks completed this week vs. tasks planned
- Overdue tasks (and who owns them)
- New leads received this week
- Conversion rate this week (leads → discovery calls booked)
- Invoices sent this week
- Invoices paid this week
- Cash received this week
Client-facing project update:
- Tasks completed since last update
- What's in progress right now
- What's coming up next week
- Any blockers or items needing client input
Write this down. Then ask yourself: for each data point, which tool holds that information? This mapping exercise is the blueprint for your Make.com scenario.
💡 Pro tip: Before building the automation, send this list to whoever currently produces the weekly report and ask: "Is there anything on this list you don't actually use to make decisions?" If the answer is yes, cut it. Simpler reports get read. Complex reports get skimmed.
✅ After this step: You know exactly what data you need, where it lives, and what the report should say. Building the automation is now a matter of connecting the dots.
Step 2: Make Sure Your Data Is Clean
This step cannot be skipped. Automated reporting is only as good as the underlying data.
Before building anything, do a quick data hygiene check:
In ClickUp or Notion:
- Are task statuses being kept up to date?
- Are due dates set on every task?
- Are tasks assigned to the right people?
In Airtable/ Google Sheets:
- Are lead statuses being updated after every interaction?
- Are dates recorded consistently?
In your invoicing tool:
- Are invoices marked as paid when payment lands?
- Are all invoices in the system (not just emailed as PDFs)?
If the data in your tools isn't reliable, your automated report will just deliver bad data faster.
⚠️ Automated reporting reveals data problems you didn't know you had. This is actually a benefit. You'll see immediately when data is being missed. But it means the first few reports may surface gaps you need to fix.
Step 3: Set Up Google Sheets as Your Reporting Hub
Google Sheets is the best central location to compile data from multiple tools before formatting and delivering a report. Make.com can write data from ClickUp, Airtable/ Google Sheet, and your invoicing tool into a single sheet automatically.
Create a sheet with:
- One row per week (or per report period)
- One column per data point from your list in Step 1
- A "Week of" column that Make.com fills in automatically
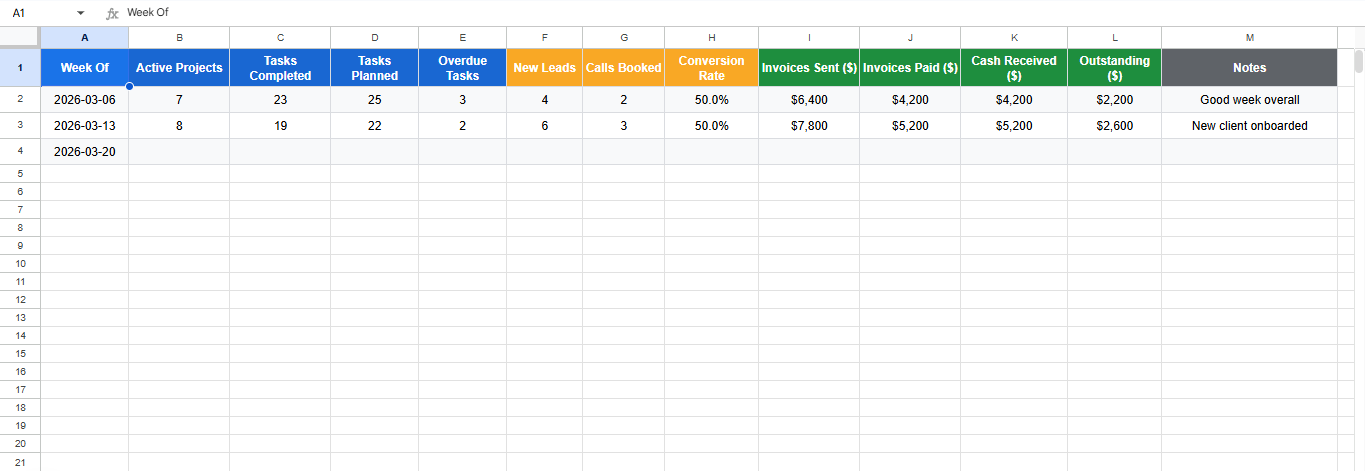
This sheet serves two purposes:
- It's the intermediate step before formatting the report
- It becomes a historical record you can look back on over time
💡 Pro tip: Once you have 8–12 weeks of data in this sheet, you'll start to see patterns. Busier periods, conversion trends, payment cycles. That's valuable business intelligence you'd never get from ad-hoc manual reports.
Step 4: Build the Make.com Data-Pull Scenario
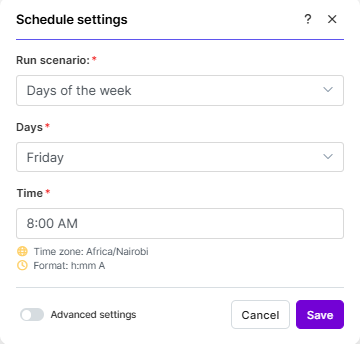
Create a scheduled Make.com scenario that runs every Friday at 4pm (or whatever timing makes sense for you). Here's what it does:
Module 1 — Scheduled trigger Set the schedule: every Friday at 4pm.
Module 2 — ClickUp: Get Tasks Use the ClickUp "Search Tasks" module to pull:
- Tasks with status "Complete" updated this week → count them
- Tasks with status "In Progress" → count them
- Tasks with a due date before today and status not "Complete" → these are overdue
Module 4 — Your Invoicing Tool: Get Invoices Use the relevant module (Wave, QuickBooks, Stripe) to pull:
- Invoices sent this week → sum the amounts
- Invoices paid this week → sum the amounts
Module 5 — Google Sheets: Add a Row Write all the collected data into your reporting sheet with this week's date.
✅ After this step: Your Google Sheet is being automatically updated every Friday with the week's data from all your tools.
Step 5: Format and Deliver the Report
Now you have the data. The final step is formatting it into something readable and delivering it.
Option A — Slack Summary (Recommended for internal teams)
Use Make.com's Slack module to post a formatted message to your team channel. Use Slack's Block Kit formatting to make it scannable:
📊 *Weekly Report — Week of [Date]*

🗂️ *Projects*
Active: 7  |  Tasks completed: 23  |  ⚠️ Overdue: 3

📥 *Leads*
New this week: 4  |  Discovery calls booked: 2

💰 *Invoicing*
Invoiced: $6,400  |  Paid: $4,200  |  Outstanding: $2,200
Option B — Email Report (For stakeholders or clients)
Use Make.com's Gmail module to send a formatted email. This works well for reports that go to clients or senior stakeholders who aren't in your Slack.
Option C — Google Doc or Notion Page
Make.com can create or update a weekly report page automatically. Share the link in your Slack or email. Useful if you want a document that people can annotate and discuss.
Step 6: Build a Client-Facing Version (Optional but Powerful)
If you send weekly updates to clients, the same data-pull can generate a project-specific report and send it automatically.
The only difference is that you add a filter in Make.com: before pulling data, filter by project name or client ID. This way, each client only receives data about their own project.
A client-facing weekly update can look like this:
Hi {{client_name}},
Here's your project update for the week of {{week_date}}:
✅ Completed this week: [tasks] 🔄 In progress: [tasks] 📅 Coming up next week: [tasks] ⚠️ Items needing your input: [blockers, if any]
Let me know if you have any questions. {{your_name}}
This kind of proactive update builds client trust, reduces the number of "how's it going?" emails you receive, and demonstrates that you're organised and on top of things.
Tools You'll Need
| Tool | Purpose | Cost |
|---|---|---|
| Make.com | Automation engine | Free tier available |
| ClickUp or Notion | Project and task data | Free tier available |
| Airtable | Lead and CRM data | Free tier available |
| Google Sheets | Reporting hub and historical record | Free |
| Gmail | Email delivery of reports | Free |
| Slack | Internal report delivery | Free |
Common Mistakes to Avoid
Automating a report that nobody acts on. Before building this, ask: does anyone actually use the data in your current weekly report to make a decision? If the answer is mostly "no," simplify the report first. Automate only what's genuinely useful.
Not scheduling the report at the right time. A Friday afternoon report reaches people when they're wrapping up; useful for reflection. A Monday morning report reaches people when they're planning; useful for action. Choose based on how the report is actually used.
Pulling data before it's been updated. If your team updates ClickUp on Friday morning, don't run your report at 8am Friday. Schedule it for Friday afternoon or early evening, when all updates are in.
What You've Just Built
You now have a reporting system that:
- Pulls data from multiple tools automatically
- Compiles it into a clean, readable summary
- Delivers it to your inbox, Slack, or clients on a schedule
- Builds a historical record in Google Sheets over time
You'll never pull a weekly report manually again. And you'll have better data, delivered more consistently than you ever had before.
What to Do Next
With internal reporting on autopilot, the next high-value automation is getting your content and social media running on a consistent schedule without the daily manual effort.
Read the next post: How to Automate Social Media Scheduling and Content Repurposing →
Or book a free consultation to design your reporting setup around your specific tools and team.
Keep reading — you might also like these

From 6 Hours to 4 Minutes: Automating Proposals for Founders Freedom Africa
How we automated Founders Freedom Africa's proposal process using Google Forms and Make.com — cutting proposal creation from hours to minutes, with follow-up built in.

No More Dropped Leads: Automating Client Onboarding for Founders Freedom Africa
How we used ClickUp and Make.com to automate every onboarding touchpoint for Founders Freedom Africa — from welcome email to signed agreement, with no manual handoffs.